

Diagnostic menu
Advanced Biological Age & Epigenetics
Biological ageing insights for healthcare professionals.
Blood sample: at-home collection kit or in-clinic blood draw using a standard lavender EDTA tube.
- 460Biologically selected CpG sites
- 21 systemsOrgan and physiological systems
- Action planPersonalised, with a clinician dashboard
Overview
Ageing is not one number
A blood-based epigenetic test that quantifies age-associated dysregulation in DNA methylation patterns. Rather than treating ageing as a uniform linear process, it evaluates biological variability across selected CpG sites and resolves the signal into organ- and system-specific ageing profiles.
DNA methylation is an epigenetic mechanism involved in regulating gene activity. Unlike the underlying DNA sequence, methylation patterns can change over time and are influenced by ageing, lifestyle and environmental factors. Research led by Prof. Irina Conboy and colleagues shows that ageing is associated not only with changes in methylation levels, but also with increasing variability, or epigenetic noise, reflecting declining regulatory control.
- 01
Biological noise
- Measures variability in DNA methylation patterns
- Associated with age-related loss of epigenetic regulatory control
- 02
System-level insight
- Groups 460 CpG sites into functional systems
- Shows where age-associated dysregulation is greatest
- 03
Non-linear ageing
- Places each system within an age-related trajectory
- Gives context on how dysregulation changes with ageing
What is measured
What the patient report includes
The report translates epigenetic ageing signals into a system-level profile, so patients and healthcare professionals can see relative differences across biological systems and follow changes across repeat assessments.
Whole-body view
Biological age and rate of ageing for the whole body.21 body systems
Biological age and ageing rate for each of 21 organ and physiological systems.Trajectories
System-specific ageing trajectories and noise curves.Highest signals
The systems showing the highest relative ageing signals.Change over time
Longitudinal comparison to monitor biological change.Action plan
A preliminary personalised action plan for clinician review.
Inside the report
What the report shows
Biological noise
What is measured: methylation at CpG sites
Non-linear ageing
What your patients see
Calendar age 27 in this example.
- Cardiac system
- Muscular system
- Mitochondria health
- Nervous system
- Male reproductive system
Recommendations are reviewed and adjusted by the clinician.
21 organ and physiological systems

- Brain health & cognition
- Nervous system
- Auditory system
- Cardiac system
- Blood & vascular system
- Respiratory system
- Digestive system
- Hepatic system (liver)
- Blood sugar & insulin control
- Urinary system
- Metabolism
- Male / female reproductive system
- Skin health
- Muscular system
- Skeletal system
- Immune system
- Mitochondria health
- Inflammatory regulation
- Tissue regeneration
- Fibrosis / scar tissue formation
- Oncogenesis / cell mutation
Markers behind each system
What you get
Clinician-led, patient-friendly
For the patient
- Whole-body biological age and rate of ageing
- Biological age and ageing rate across 21 body systems
- The systems with the highest relative ageing signals
- A preliminary personalised action plan
- Comparison across repeat assessments
For the clinician
- Manage: register patients, kits and testing histories
- Track: follow samples from registration to report readiness
- Review: access results and repeat assessments
- Personalise: review and customise system-specific action plans
How it works
The clinical workflow
- 01
Order
The clinician orders the test and registers the patient in the clinical dashboard. - 02
Collect
At-home collection kit or in-clinic blood draw using a standard lavender EDTA tube. - 03
Review
The clinician follows the sample and opens the patient report when it is ready. - 04
Personalise
The clinician reviews and customises the action plan in the patient’s broader clinical context.
The clinical flow
- 1Order the test and register the patient in the dashboard
- 2Monitor sample status
- 3View the patient report
- 4Review and personalise the action plan
- 1Receives the collection kit at home
- 2Kit registered: first update
- 3Sample received and processing
- 4Sample processed
- 5Report ready
- 6Views the report
The clinician dashboard
Monitoring biological change over time
- Younger than calendar age
- Older than calendar age
The sample
Two ways to take the sample

At-home collection kit
The blood sample is collected at home with the at-home collection kit.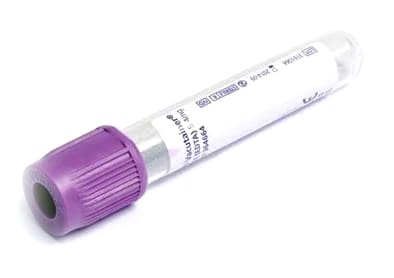
In-clinic blood draw
The blood sample is drawn in the clinic using a standard lavender EDTA tube.


Case studies
Case studies from clinical practice
Three clinic cases in which patients were measured with the biological age & epigenetic test before and after an intervention.
Case study on stem cell infusion
Decrease of 5.5 years in biological age tracked across two independent longevity clinics.
Two longevity clinics based in Germany and Mexico reported that the biological age & epigenetic test indicated a decrease of 5.5 years in biological age after stem cell infusion.
- Before
- After
- Calendar age 53
- Overall biological age51.445.9−5.5 y
- Blood & vascular system60.246.2−14.0 y
- Tissue regeneration56.947.3−9.6 y
- Urinary system56.647.8−8.8 y
Case study on therapeutic plasma exchange (TPE)
Consistent reduction in measured biological age across two TPE treatments.
From the first to the third test, measured biological age was 10.4 years lower in the immune system, 4.5 years lower in the digestive system and 6.7 years lower in the cardiac system.
- Test 1
- Test 2
- Test 3
- Calendar age 62
- Overall biological age60.460.257.8−2.6 y
- Immune system71.360.960.9−10.4 y
- Digestive system60.857.256.3−4.5 y
- Cardiac system63.960.357.2−6.7 y
Case study on stem cell infusion: three systems
Before and after a stem cell infusion, measured with the biological age & epigenetic test.
At the second test, measured biological age was 13.6 years lower in the brain system, 4.9 years lower in the reproductive system and 7.5 years lower in the urinary system.
- Test 1
- Test 2
- Brain system (nerve cells & cognition)52.338.7−13.6 y
- Reproductive system44.039.1−4.9 y
- Urinary system46.038.5−7.5 y
Individual cases reported by clinics, without a control group. They show the measured difference between tests, not that the intervention caused it, and they are not expected results for other patients.
Method and evidence
Laboratory analysis & quality framework
Analytical method
Samples are analysed on a custom DNA methylation microarray within an accredited international laboratory network. The applicable laboratory site, analytical scope and accreditation depend on the market and testing workflow.Quality & ISO certifications
ISO/IEC 17025 accredited analytical and molecular testing methods; ISO 13485 quality-system requirements relevant to medical-device frameworks; selected clinical laboratories ISO 15189 and/or CAP accredited; GLP, GCP and GMP frameworks depending on service, site and scope. Accreditations apply to specific entities, sites and scopes, not necessarily to every analytical step.Technical repeatability
One sample analysed three times across the selected CpG sites agreed 99.4–99.5% between runs, as reported by the laboratory. This shows technical repeatability, not clinical validity.Research basis
The noise approach builds on peer-reviewed work on the limits of conventional methylation clocks and on the stochastic component of epigenetic ageing.
- Mei X, Blanchard J, Luellen C, Conboy MJ, Conboy IM. Fail-tests of DNA methylation clocks, and development of a noise barometer for measuring epigenetic pressure of aging and disease. Aging (Albany NY). 2023;15(17):8552–8575. doi: 10.18632/aging.205046 | PubMed PMID: 37702598
- Tong H, Dwaraka VB, Chen Q, Luo Q, Lasky-Su JA, Smith R, et al. Quantifying the stochastic component of epigenetic aging. Nat Aging. 2024;4:886–901. doi: 10.1038/s43587-024-00600-8
- Skinner CM, Conboy MJ, Conboy IM. DNA methylation clocks struggle to distinguish inflammaging from healthy aging, but feature rectification improves coherence and enhances detection of inflammaging. GeroScience. 2025;47(3):3043–3060. doi: 10.1007/s11357-024-01460-1 | PubMed PMID: 39825170
- Ma S, Wang S, Ye Y, Ren J, Chen R, Li W, et al. Heterochronic parabiosis induces stem cell revitalization and systemic rejuvenation across aged tissues. Cell Stem Cell. 2022;29(6):990–1005.e10. doi: 10.1016/j.stem.2022.04.017 | PubMed PMID: 35613617
Clinical value
Monitoring biological change over time
Repeat testing enables longitudinal comparison of epigenetic ageing profiles and may help characterise biological change over time.
- 01
Baseline
See which systems show the highest relative ageing signals. - 02
Intervene
Use the clinician-reviewed action plan alongside other clinical information. - 03
Re-measure
Compare system-level profiles across repeat assessments.
Measure → Intervene → Re-measure → Verify
Availability
International & EU availability
Advanced Biological Age & Epigenetics is the international version of the test. For the EU, talk to our team.
- International markets
Advanced Biological Age & Epigenetics
- The international version of the test
- 21 organ and physiological systems
- System-level epigenetic ageing profiles
- Biological noise and longitudinal comparison
- At-home collection kit or in-clinic blood draw using a standard lavender EDTA tube
- European Union
EU version
- Talk to our team about availability in your market.
White-label opportunity
Your programme. Your brand. Our infrastructure.
The biological age test can be integrated into healthcare, longevity and preventive-health programmes as a branded or co-branded testing pathway, without building the laboratory infrastructure behind it.
- Branded test kits and packaging
- Integration into existing clinic or longevity programmes
- Remote sample collection
- Laboratory analysis
- A patient-facing experience in your name
- Results delivered into your preferred reporting environment
- Repeat testing and longitudinal programmes
Remote access
Sample collection at home, outside the clinic.System-level depth
Organ- and system-specific ageing profiles with a clinician dashboard.Longitudinal use
Repeat testing to follow change over time.
Limitations
Clinical note
Results provide information about biological ageing-associated epigenetic patterns and should be interpreted within the broader clinical context. Biological age, ageing-rate and system-level outputs are not diagnoses and should not be used independently to diagnose, prevent or treat disease, or to determine treatment efficacy.
Results should be considered alongside relevant clinical assessments, established biomarkers and professional judgement. Product configuration, intended use, laboratory workflow and regulatory status may vary by market.
Contact
Thirty minutes, and you will know whether this fits your clinic.
Tell us how your clinic works today and which patients you see. We will go through the portfolio, what can be offered in your market, and what your team would need from us.